
Though dashboards may not be the most foundational EHR feature, they are important tools that help providers improve outcomes and manage the health of their operation.
Let’s break them down.
What is an EHR Dashboard?
Dashboards are data visualization tools that allow an organization to supervise and review user performance in the system.
We call them tools, and they certainly are, because they assist users in accomplishing tasks. However, dashboards aren’t tools in the way that a hammer is a tool.
Instead, think of dashboards as the equivalent of the gas gauge in your car. They are both instrumentation that presents a lot of data in a consolidated view.
To continue with the gas gauge example, think of all the intricate mechanisms and engineering that propel your car forward and burn gasoline. Our gas gauge does not clutter our view behind the wheel with status readings of each of those processes.
Rather, it provides a simple status report of how much farther your car can travel based on the current performance of those processes.
.jpg)
In the same way, dashboards give EHR users specific snapshots of data that illustrate the health or status of a given area of your operation.
Thus, dashboards provide a critical oversight function in the EHR environment. As a result, they are most commonly used by managers, supervisors, and directors to monitor the full business spectrum, from treatment and staff productivity to compliance and billing.
It is also important to note that EHR dashboards are real-time in nature. Their advantage is twofold:
- They present various/complicated data in an easily digestible way (graphs, charts, etc.)
- They update in real-time so that the data presented is always the most current snapshot of performance
To be used as a tool, dashboards must be constantly going, updating in accordance with each relevant change in the system. That is the only way to help the user make an informed and accurate decision every single time.
In the spirit of data visualization, we’ve broken down EHR dashboards into three categories:
- Clinical/Provider Level
- Enterprise Level
- Supervisor/Management Level
Read on as we examine each dashboard example below.
1) Clinical/Provider EHR Dashboards
These dashboards are large scale data visualizations that help organizations maintain performance and be more efficient in everyday clinical workflows.
A great example of a clinical dashboard is one that tracks expiring treatment plans. Treatment plans are important documentation that serve multiple purposes in the overall clinical operation.
A dashboard that allows a provider to monitor the status of treatment plans offers critical regulatory assistance. For example, Medicaid and Medicare guidelines require all patients to have an active treatment plan, as do the compliance standards for JCAHO and CARF.
Dashboards that present upcoming treatment plan expirations empower clinical staff to renew any treatment plans ahead of time to always maintain compliance in that area.
Then, from an oversight perspective, these dashboards can be used by leaders to monitor if their team is completing treatment plans, or getting lax with them. As a result, a leader knows exactly where they must intervene to improve performance or productivity.
Because those shortcomings are so precisely identifiable by the dashboard, you can confidently make swift changes to remedy the situation. Thus, clinical efficiency is improved, which in turn contributes to the overall efficiency of the entire operation.
2) Enterprise EHR Dashboards
Another type of dashboard visualizes data on a more comprehensive, or enterprise, level. These dashboards help users monitor the status, or overall health, of an area of your operation.
Financial dashboards often serve this enterprise scope, which assists providers in managing the health of their business.
Ideally, behavioral health billers are equipped with dynamic financial dashboards to empower them to complete billing tasks with ease.
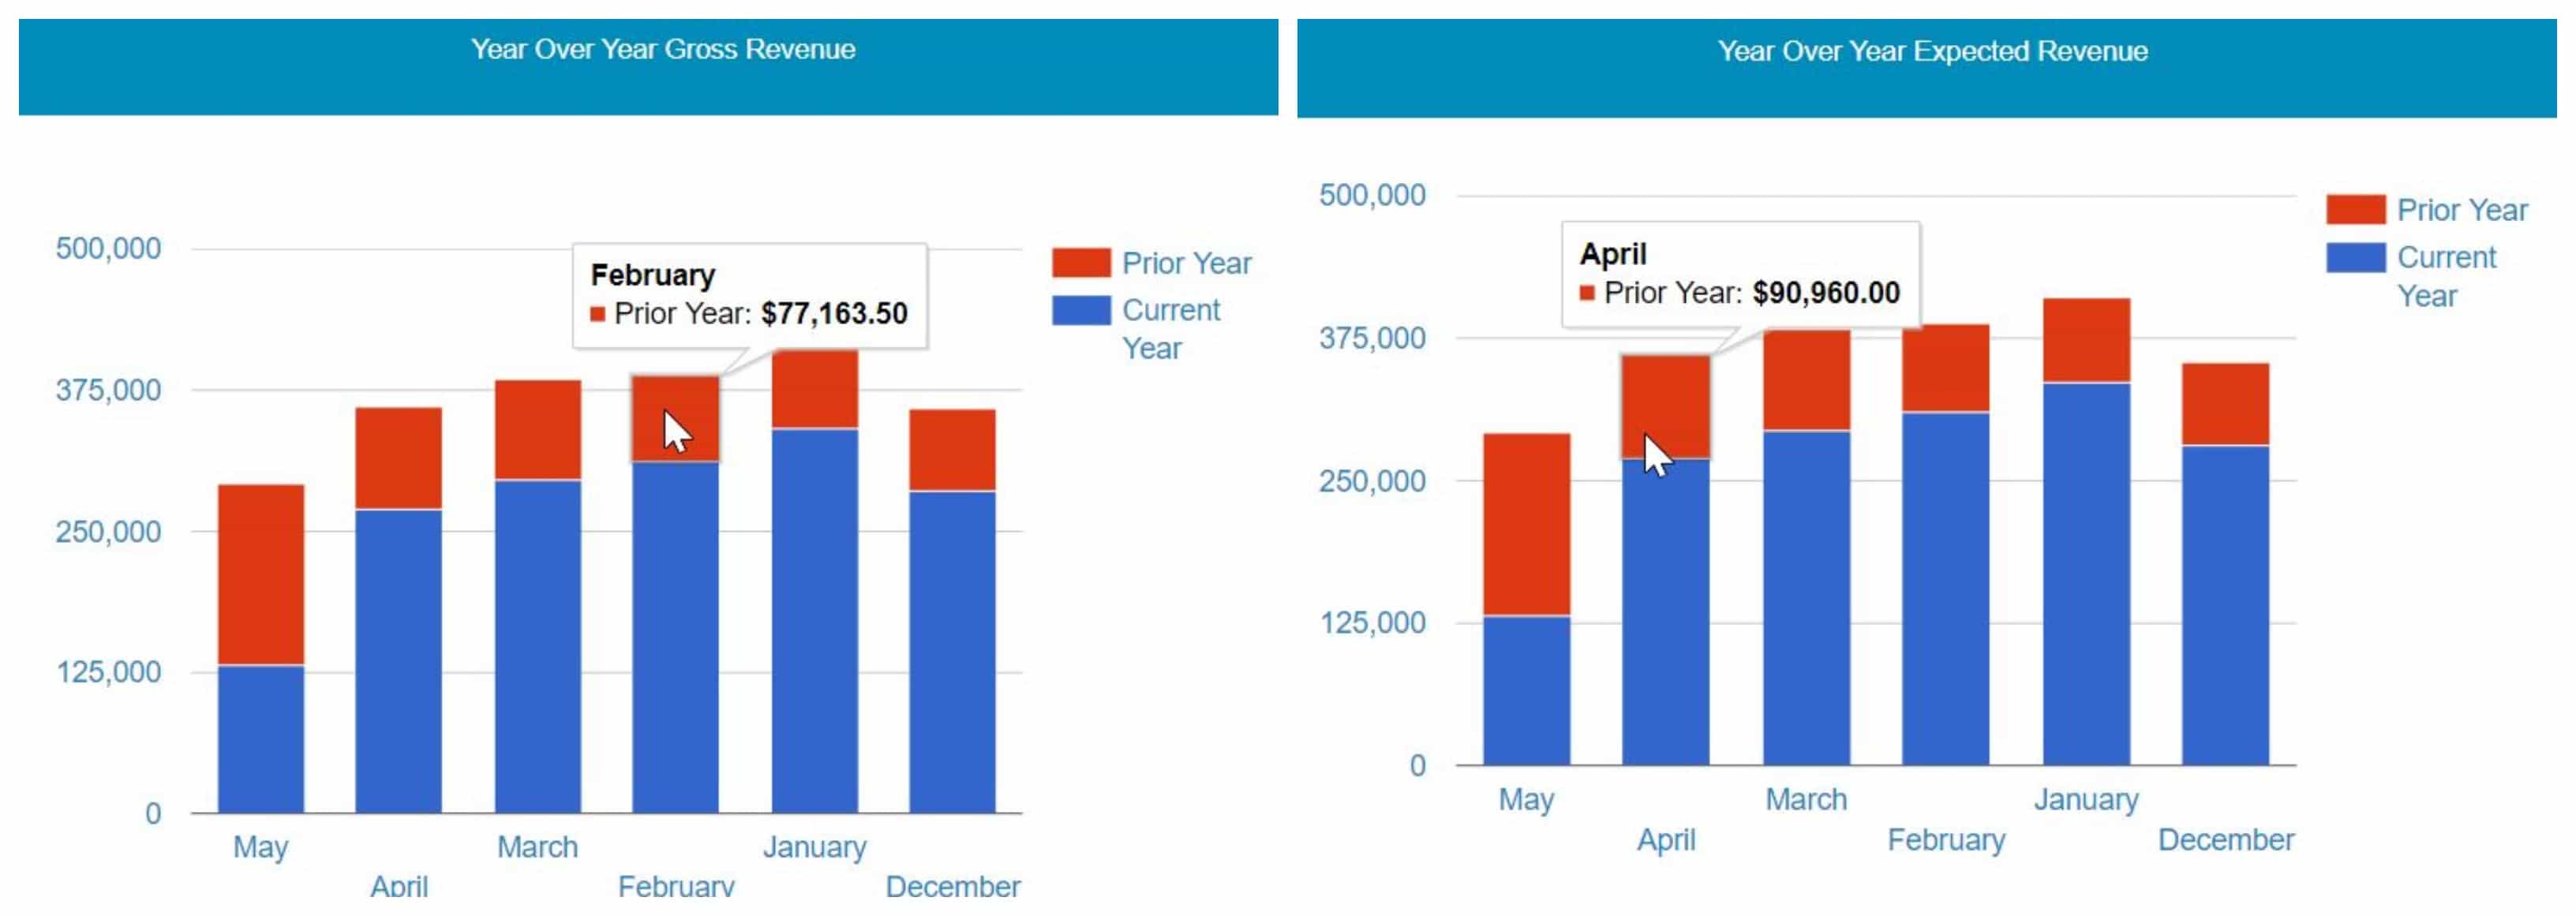
A great example of a useful financial dashboard is one that tracks your expected vs. collected revenue. This allows billers to track how much revenue they are recouping from payers, which has become an even more important metric during the pandemic.
From this billing snapshot, finance leaders can get a sense of how accurate and efficient their team is creating claims at a glance.
The following images are an Expected Revenue and Collected Revenue Dashboard from AURA, Sigmund Software’s enterprise software solution, that compares the metrics by year.
Another type of enterprise dashboard is one that presents population data in a way that helps organize patients in your system.
Common census dashboards allow users to break down populations in categories such as client funding source or client diagnoses.
These dashboards are important tools for general metrics like census so that providers always have an up-to-date picture of their population.
3) Supervisor/Leadership EHR Dashboards
These dashboards mostly help site leadership in an oversight capacity. They allow relevant users to keep an eye on their team’s performance.
In the hectic clinical environment, supervisors rarely have a chance to monitor their entire team in real-time. That is where such supervisory dashboards come in to play.
In their free moments, supervisors can refer to oversight dashboards to check in on staff productivity – who is late on their documentation, who only has 80% of their items done, and so on.
As a result, leaders can quickly view any weak links on the team or in the process and then intervene accordingly. As those improvements are made, productivity on the whole improves, which then helps staff treat patients even more efficiently.
EHR Software: Further Education
We hope you have a better understanding of EHR dashboards. They can be an abstract concept if you are not familiar with EHR technology.
However, once our clients become acquainted with the dashboards at their disposal, they quickly adopt them as an invaluable software tool.
We mentioned that dashboards are most commonly used by supervisors, such as a system administrator. Check out this blog post that highlights 4 critical skills for any system admin. It can provide some guidance as you identify individuals at your organization who are well suited to use dashboards in an oversight capacity.